Knowledge Base
Designer
Designer Overview
Designer Version History
Designer Automations
Designer Programs
Designer Profiles
Designer Patients
Designer Custom Data
Designer Visual Components
- Visual Components
- Visual Components & Dependencies
- Filtering With Message Template Variables
- Filtering With Message Template Variables
- How To Create an Assessment or Form Template
- How To Associate Assessments with Programs
- How to Add Assessments to a Template
- How to Configure Scored Assessments
- Create PDFs from Forms & Assessments
- Create Patient Facing Assessment (PFA) Folders
- Charts & Graphs: How to Configure
- Charts & Graphs: Filter, change date and by data point
- Forms: Conditional Logic
Designer Access Control
Designer Task Management
Designer Encounters
Designer Communications
Designer Terminology
Designer Help Page
Charts & Graphs: How to Configure
Charts and Graphs are used to monitor data, results, and scores over a period of time. The data will be pulled from CDTs that are either Integers or Floats. Data can also be pulled from Assessments that have Scoring conditions tied to answers. To learn, more about How to Configure Scored Assessments.
On the left menu bar select the “Charts and Graphs” under “Visual Components”.
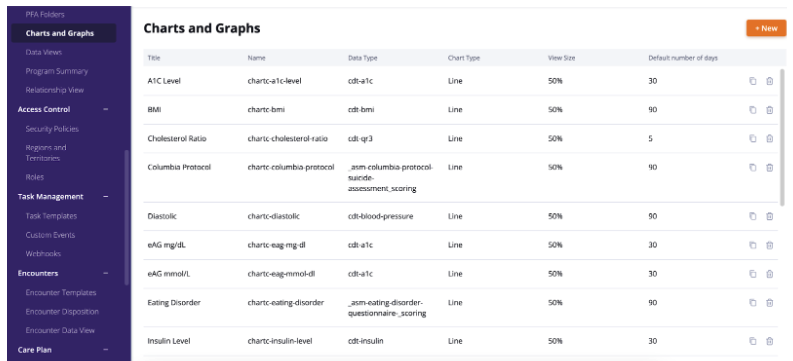
To create Charts and Graphs click “+ New” on the right side of the screen.
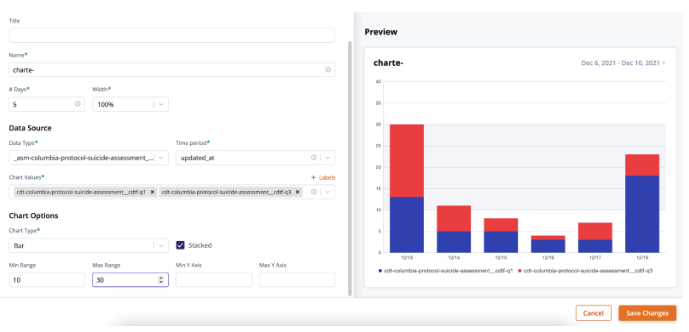
- Create a Title of the Charts and Graph. This will be what is displayed in the Care portal.
- Define the Name of the Charts and Graph. This field will auto populate based on the Title of the Charts and Graph, but can be changed manually if desired.
Data Source
- Define the “# of Days” you would like to look back to view as a default. This will display on the x-axis.
- Select the desired display “Width”: 50% half of the screen or 100$ full screen
- Select the Data Type that you wish to display as a Chart and Graph. The list will include any Assessment that has Scoring conditions.
- Decide the “Time Period” you would like data to be displayed on the Chart and Graph: created_at or updated_at
- Chart Value will allow you to select one or multiple qualified CDTFs that you would like to have demonstrated on a Charts and Graph. Qualified CDTFs are as follows: Integers, Floats, or Assessment questions containing Scoring Conditions
- + Labels allow you to rename how the CDTFs show in Care
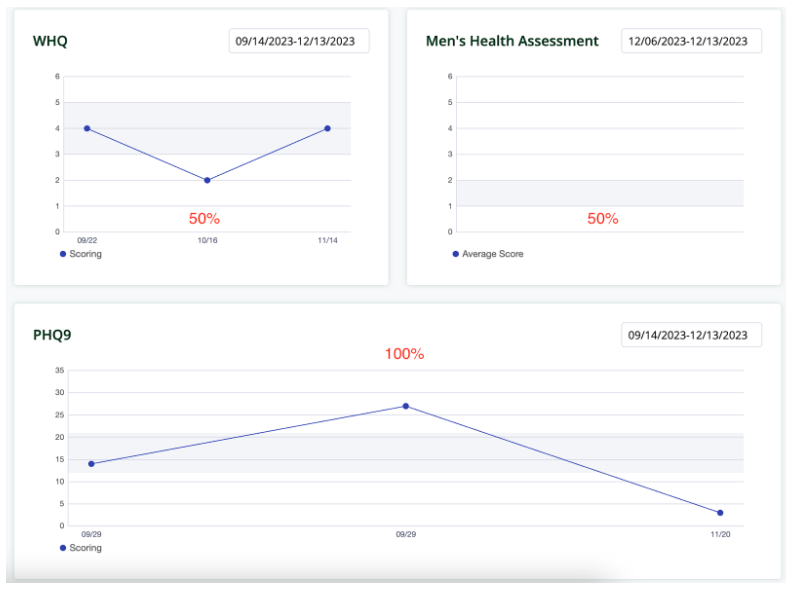

Chart Options
- Select the desired Chart Type:
- Line
- Bar
- Horizontal Bar
- Stacked will only display when selecting Bar or Horizontal Bar graph is selected
- This will allow you to stack the Bars when multiple Chart Values are selected
- Min and Max Range allows you to see grayed watermark visuals in Care to call out normal or abnormal metricsMin and Max Y Axis will allow you to set the default ranges based upon the data values collected
- Save Changes
In order for the Charts and Graphs to show in Care you will also need to create the Chart and Graph into a Data View. After the Data View has been created you will need to add the Data View to a Navigation (Layout). See here for more information on Data Views.
More Questions?
If you have any questions, please visit the Welkin Health Knowledge-Base or contact your Implementation/CSM for more information.