Introducing Data Views: Every Role Sees Exactly What They Need — No Code Required
by Welkin Health| Aug 31, 2026
Ask five people on a care team what they need to see on a patient’s profile, and you’ll get five different answers. A nurse wants the latest vitals and medication list front and center. A behavioral health specialist wants recent assessment scores and a trend line. A program manager just wants a quick summary of what’s changed since last week. Too often, healthcare technology forces everyone into the same view — or forces your team to file a ticket and wait weeks for a developer to build something custom. That’s exactly the gap our new Data Views, including a built-in AI Data View, were built to close.
Why patient data views usually fall short
If you’ve tried to configure patient-facing or care-team-facing views inside a health tech platform before, some of this will sound familiar:
One-size-fits-all layouts. Every role sees the same pages, whether or not the information is relevant to their work.
Developer dependency. Changing what a page shows, or how it’s organized, means a request to engineering — and a wait.
Data buried in silos. Vitals, labs, medications, assessments, and uploaded documents each live in their own corner, making it hard to get a full picture of a patient at a glance.
No room for nuance. Every program is different, but most platforms assume every program wants to work the same way.
Manual chart review. Care teams spend real time scanning records for patterns instead of getting a quick, trustworthy summary.
Data Views is our answer to all five.
What Data Views actually does
Data Views lets administrators configure exactly what each role sees — and how they see it — directly in Welkin Designer, with no code involved. You define page visibility, layouts, and data presentation by role, so a workspace matches the way your program actually runs.
Here’s what that looks like in practice:
Role-based, no-code configuration. Decidewhich pages each role can see and how those pages are organized, all through a visual designer interface. No engineering tickets, no waiting on a release cycle.
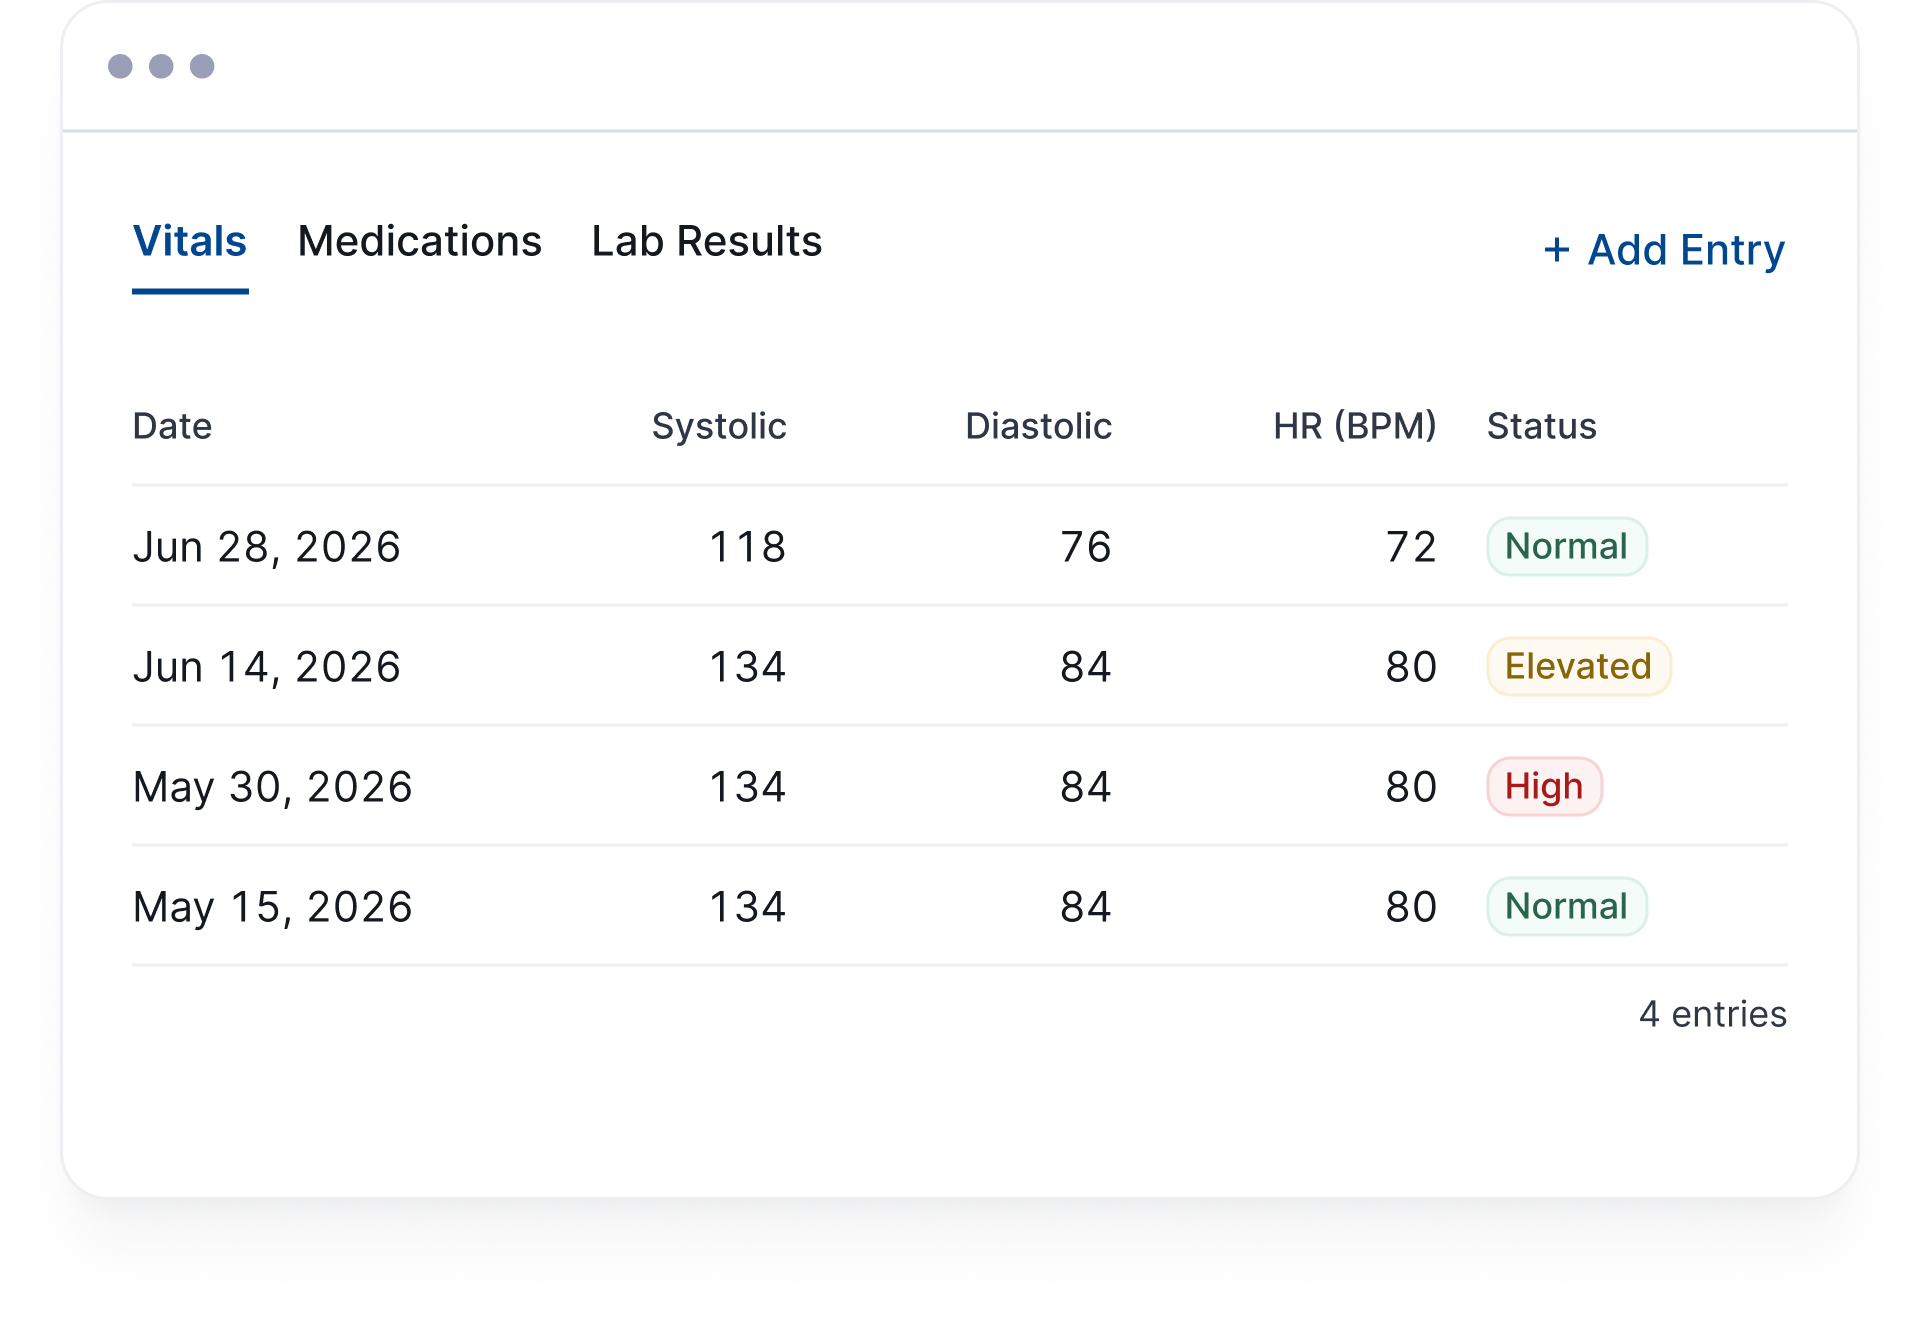
Table Views for structured clinical data. Get spreadsheet-style displays of Custom Data Types like vitals, medications, and lab values — sortable, filterable, exportable to CSV, with inline editing and date-stamped entries. Care teams can review a full history or add a new entry in seconds.
Line Charts for trends that matter. Track numeric fields or scored assessments over time, with goal lines and the ability to overlay two metrics at once. Teams can adjust the date range to zoom in on exactly the window they care about.
Document View for everything else. Uploaded files, signed consent forms, and intake paperwork surface right in the patient profile — no digging through a separate document system.
Navigation and branding that feel like yours. Drag and drop to reorder pages, give pages role-specific names, add your own logo, and publish changes live without interrupting anyone already using the portal.
Accessing Data Views day to day
For care teams, using Data Views doesn’t require any new training. Open a patient profile, navigate to the relevant Data
View or CDT section (your organization may have renamed it to match your workflow), and select the data type you need. Each row represents a single entry — a blood pressure reading, a medication fill, a lab result — with columns matching the fields you’ve defined. Adding a new entry is a click on “+ Add Entry,” and editing an existing one is a click on the row itself, subject to whatever locking rules your organization has in place for finalized records.
The AI Data View: summaries that write themselves
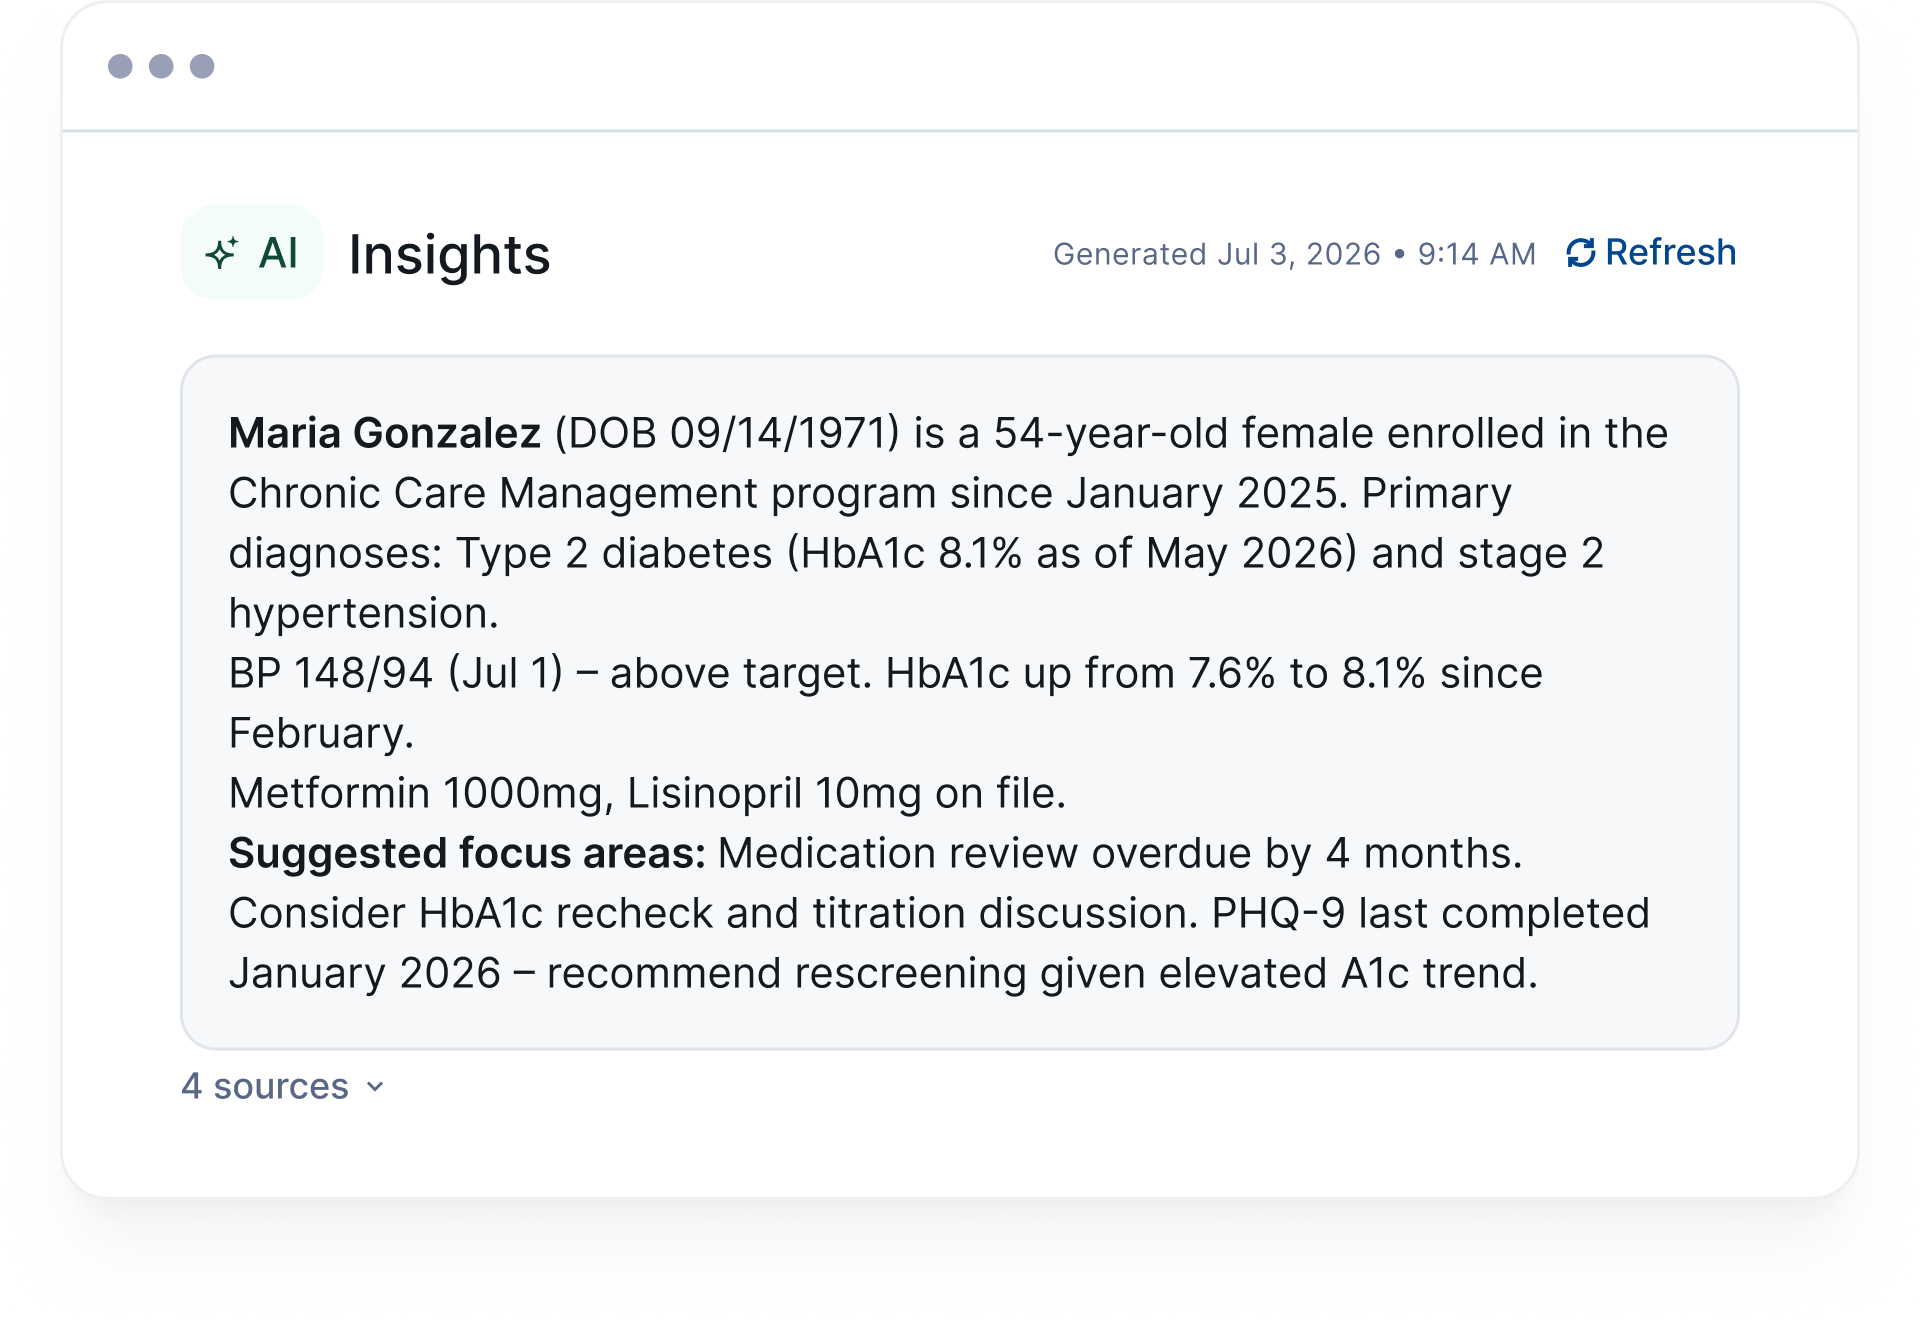
The most requested capability inside Data Views is also the newest: the AI Data View. Instead of manually reviewing a patient’s chart to answer a recurring question, administrators configure a prompt once, and Welkin AI generates the answer directly inside the patient record — every time it’s needed.
An AI Data View can be configured to:
Summarize recent program activity
Answer a specific clinical or operational question
List outstanding assessments
Pull together any prompt-driven output grounded in the patient’s actual data
Every AI-generated result is clearly labeled with an AI badge and a “Generated on” timestamp, so your care team always knows what they’re looking at and when it was produced. If a summary is still being generated, the widget shows a simple “Thinking…” state; if generation fails, it says so and offers a one-click retry. Summaries also refresh automatically as underlying patient data changes, or can be refreshed manually — and the previous summary stays visible while a new one generates, so no one is ever staring at a blank screen.
Configuring an AI Data View takes three steps in Designer: write your prompt, optionally add context references (pointing to specific CDTs, assessments, programs, or encounters the AI should draw from), and set an outdated threshold — the number of days before a summary is flagged for regeneration, which defaults to seven. Save, publish, and the summary starts appearing in patient records immediately.
Built for how your program actually works
Underneath all of this is a simple idea: your care team’s workspace should match your program, not the other way around. As one Welkin customer put it:
“The Welkin platform is the single source for all of the information for our members.”
That’s the goal of Data Views — one configurable, role-aware home for every piece of patient information your team relies on, whether it’s a table of lab values, a trend line, a signed consent form, or an AI-generated summary that would otherwise take ten minutes of manual chart review. It’s the same philosophy behind our unified inbox for care team communications: give every role the one view that matches how they actually work, instead of forcing everyone into the same screen.
See it on your own data
Data Views, including the new AI Data View, is available now across the Welkin platform. If you want to see how it would look configured around your program’s actual workflows and data, we’d love to show you.
Healthcare information technology has played a major role in the advancement of healthcare in recent years. The Health Information Technology for Economic and Clinical Health (HITECH) Act of 2009 helped to transform healthcare facilities and modernize health...Read More >
Healthcare providers and care teams who know their patients well have long known that health equity challenges exist. The healthcare industry is catching up, and new programs, opportunities, and financing models are all focusing on health equity....Read More >
Recent technological advances in healthcare bring innovative approaches to improve clinical care, support better patient outcomes, and deliver superior patient experiences. These improvements have a significant effect on overall healthcare delivery system performance and costs. At the...Read More >
Sign up to receive Welkin updates, delivered straight to your inbox