AI Data View
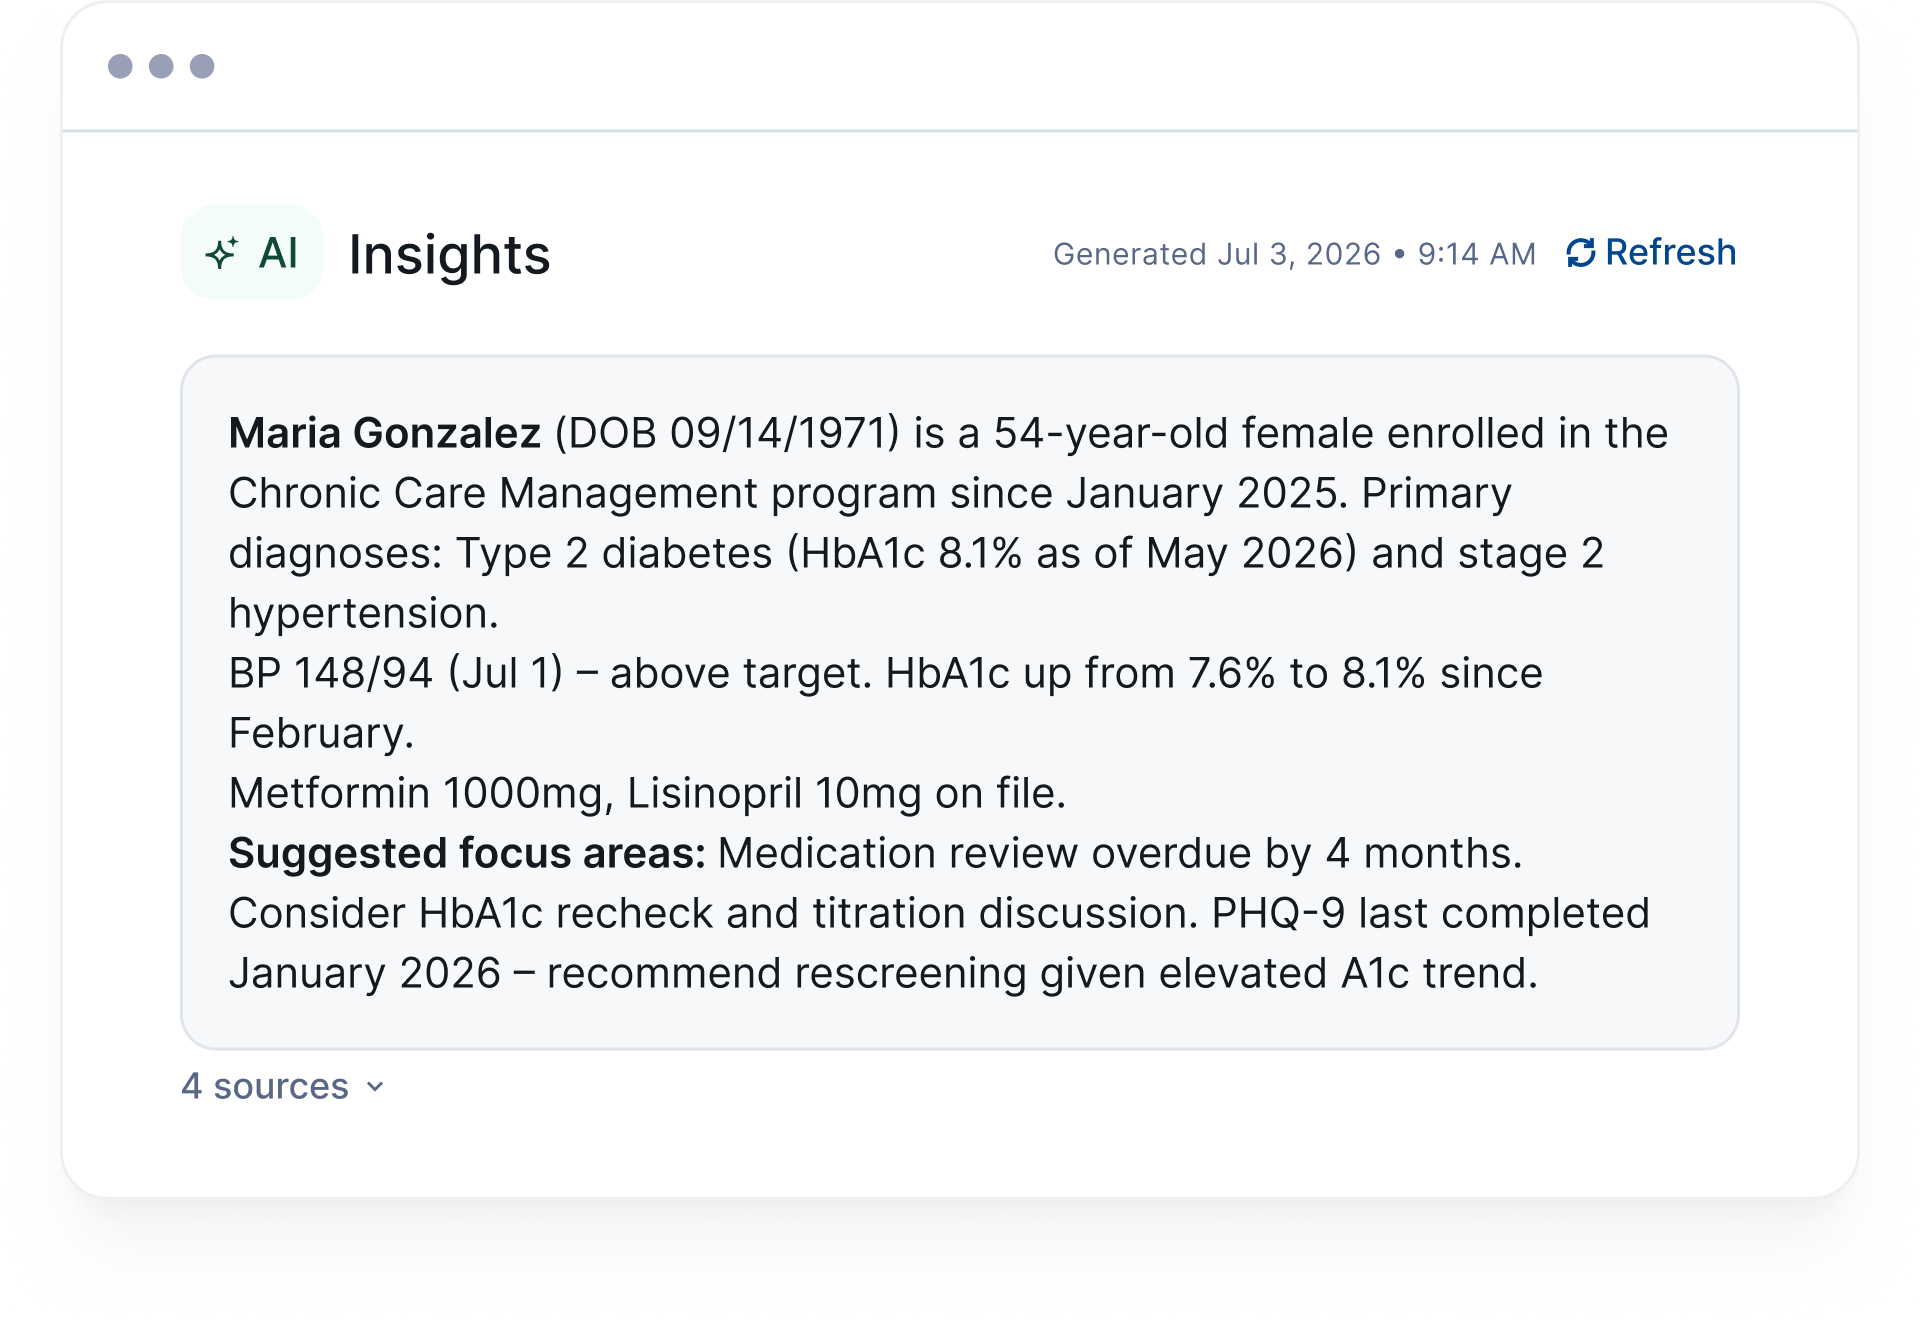
Configure a prompt once – Welkin AI generates the result in the patient record. Summaries, analyses, recommendations, care gap reviews – whatever your program needs.

Define which pages each role can see, what data gets displayed, and how the care portal looks – all without code. Configured to match your organization, no custom build required.
Welkin’s Designer lets administrators configure exactly what each care team sees inside a patient record and in what format. Data Views are the building blocks: each type serves a different clinical purpose, from structured tables and trend charts to uploaded documents and AI-generated insights.

Configure a prompt once – Welkin AI generates the result in the patient record. Summaries, analyses, recommendations, care gap reviews – whatever your program needs.

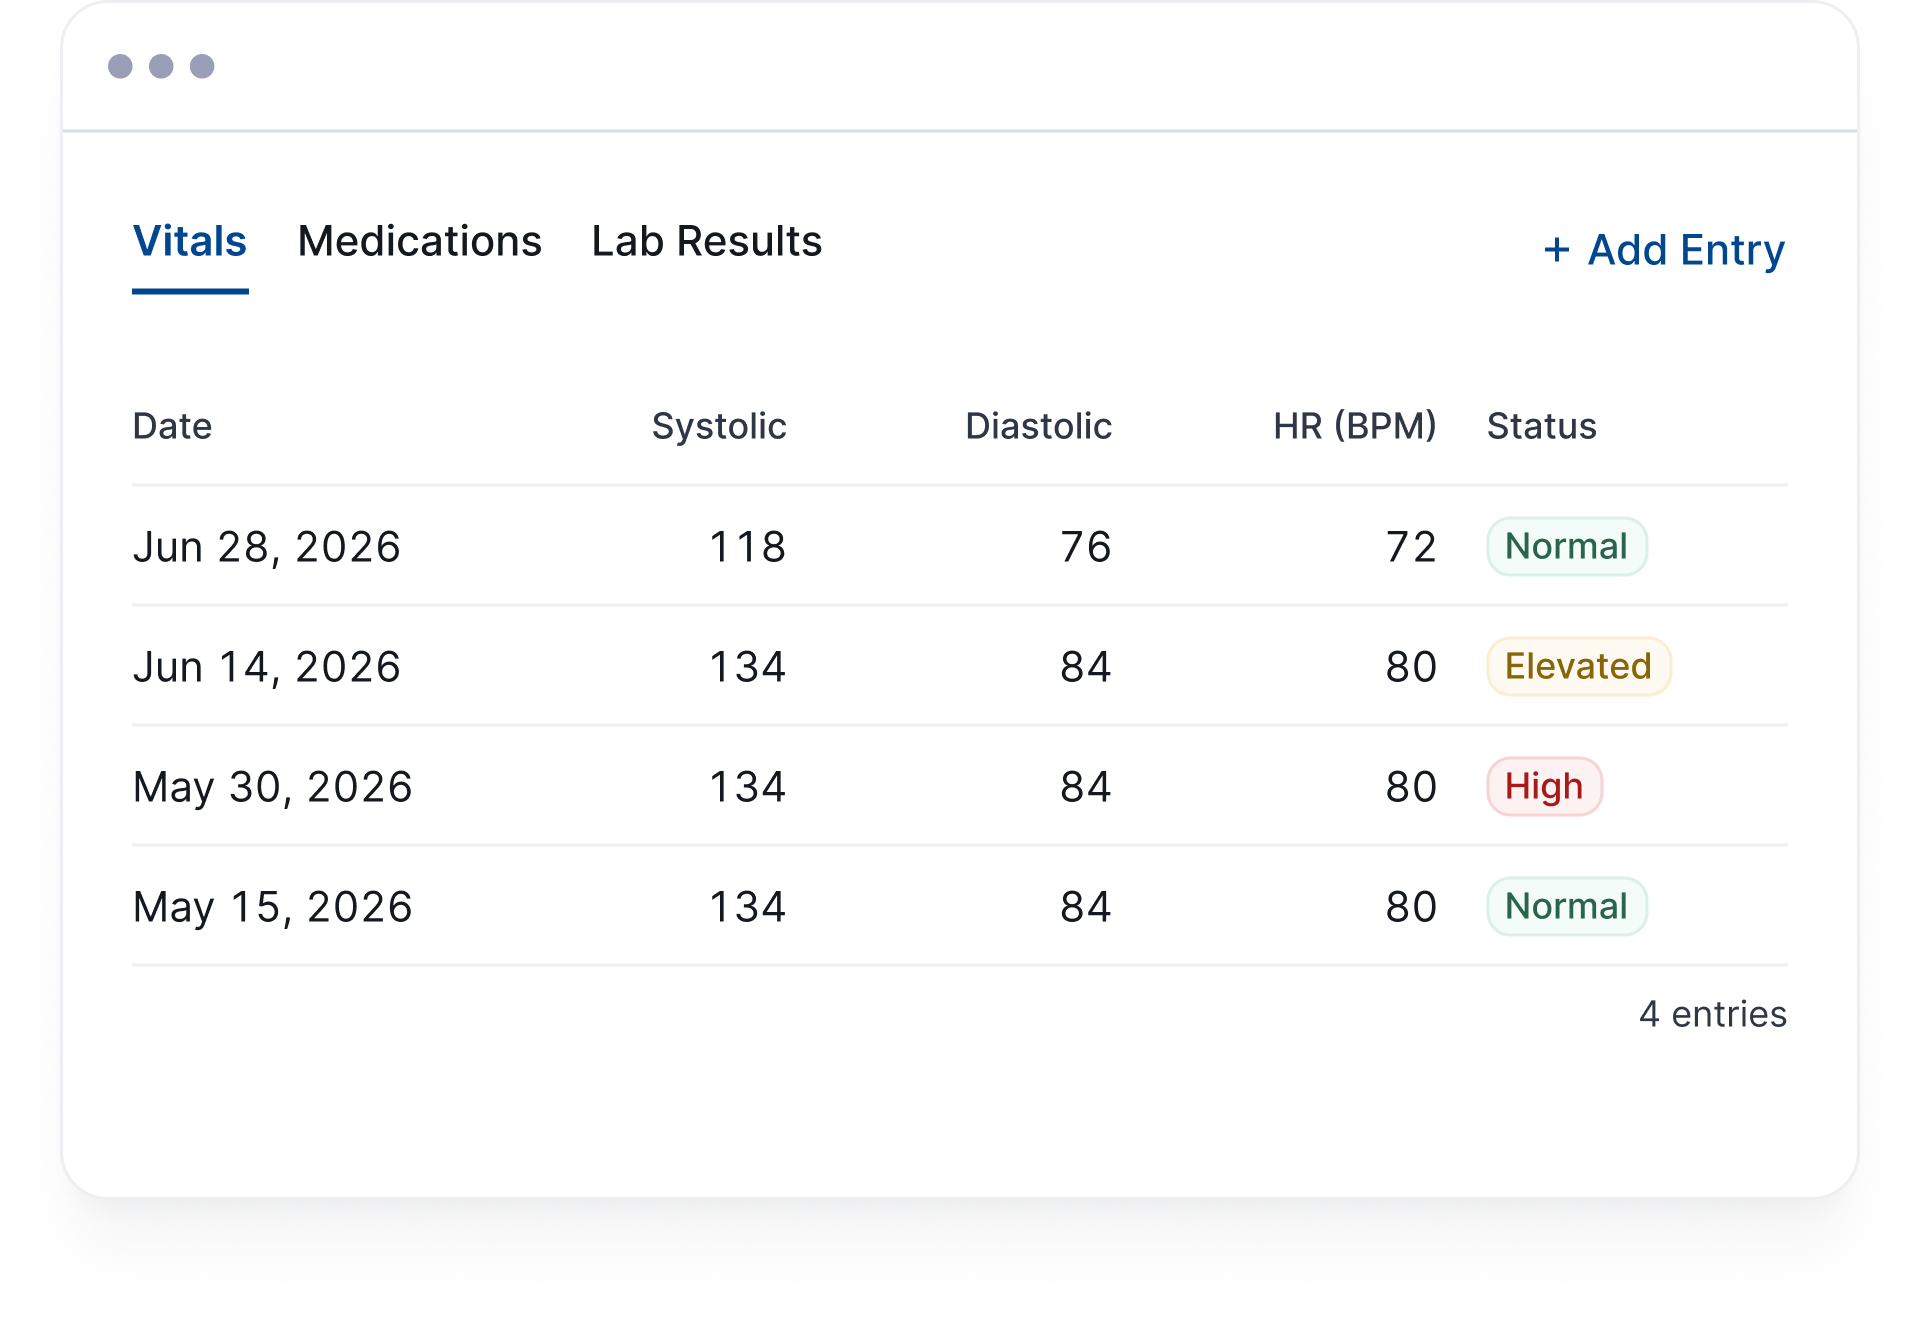
Spreadsheet-style display of CDT records. Sortable, filterable, and exportable. Ideal for vitals, medications, lab values, or any recurring structured data.

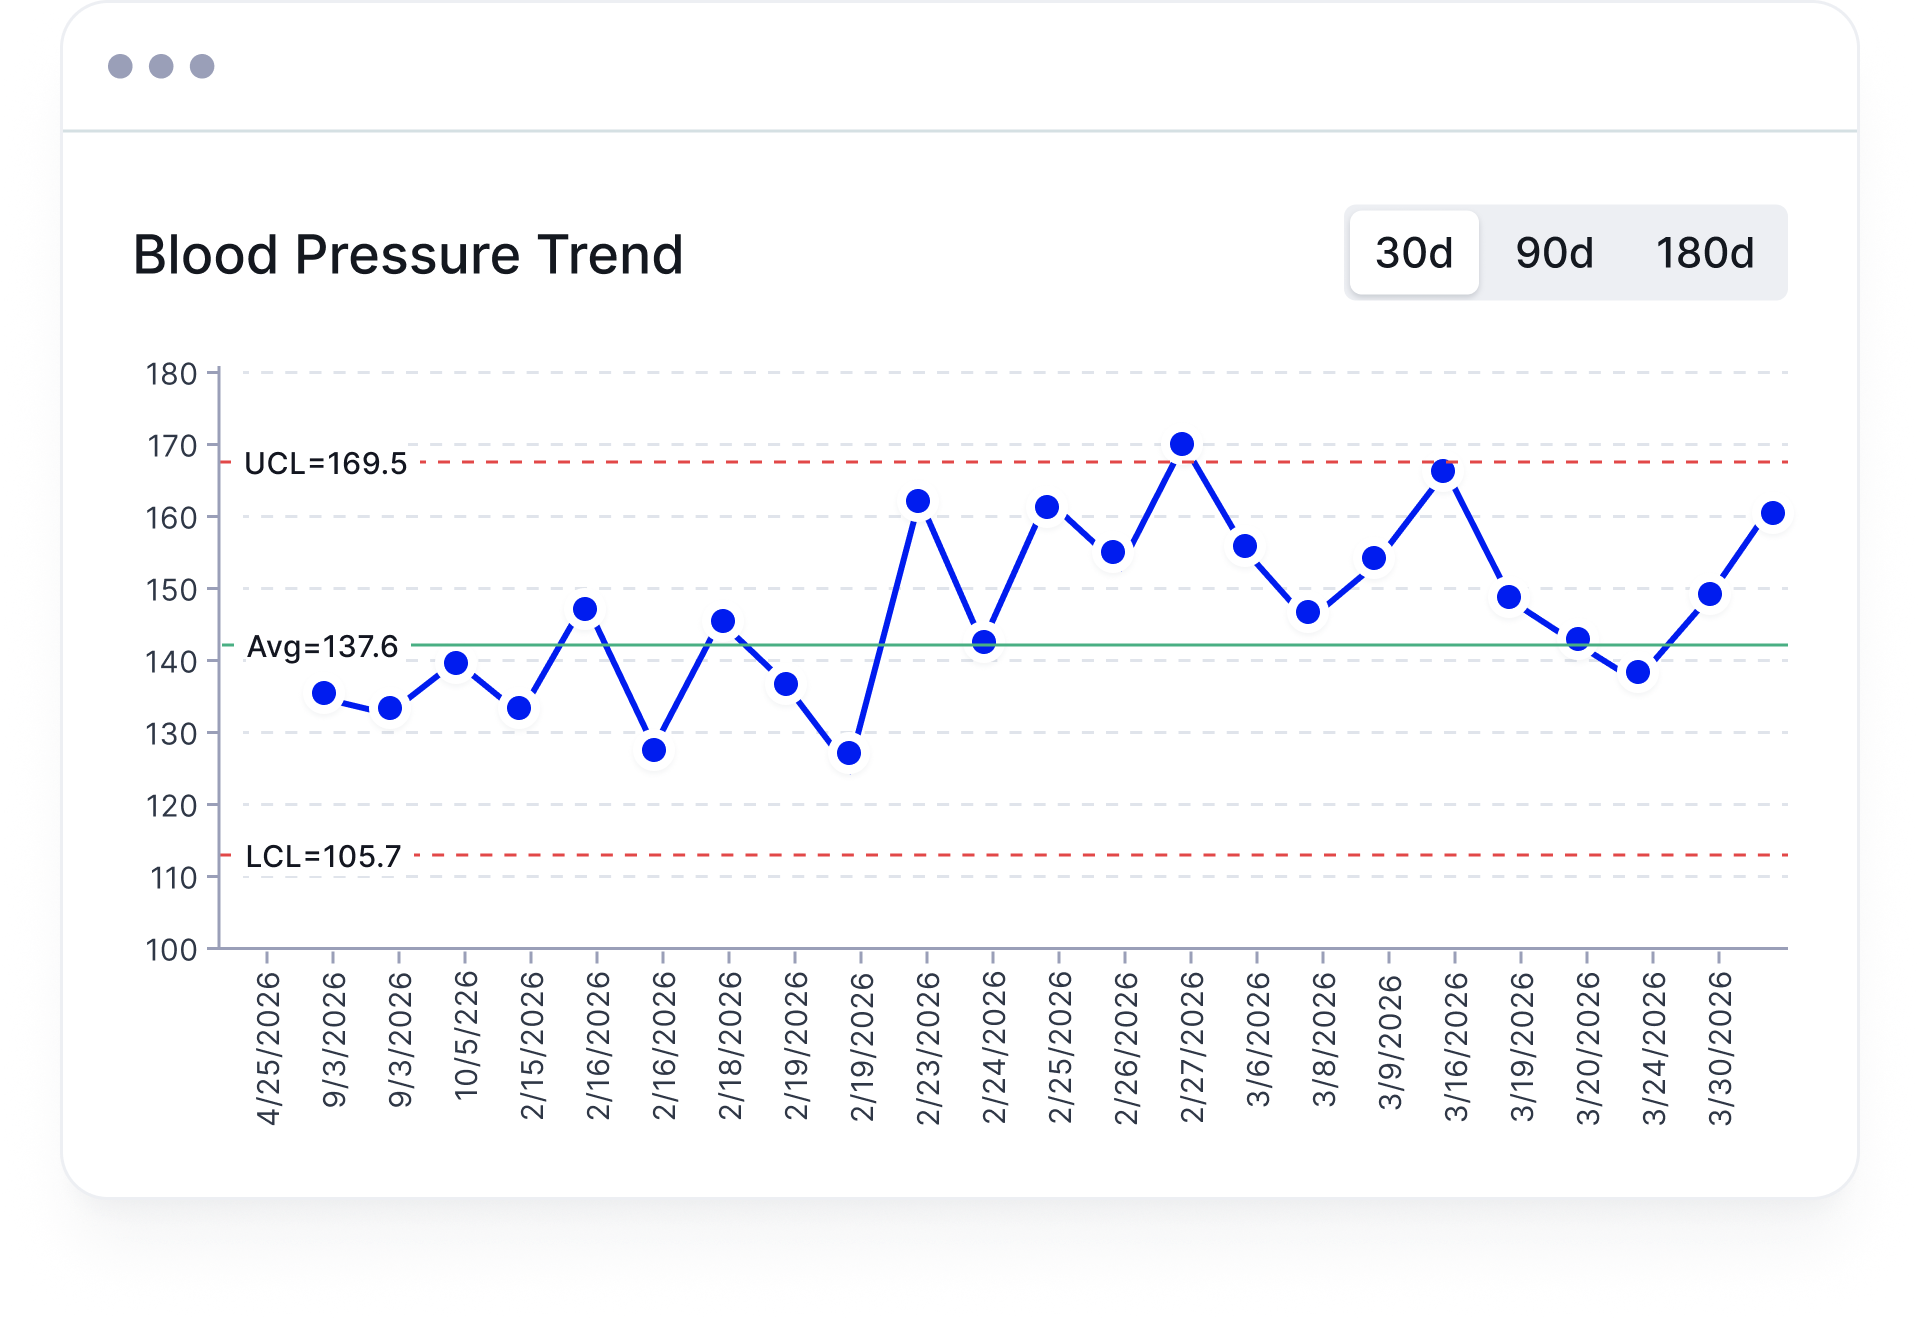
Track numeric trends over time from CDT fields or scored assessments. Supports dual metrics, goal lines, and user-adjustable date ranges.

Surface uploaded files, signed consent forms, and intake documents within the patient profile. Supports all document types.
Welkin AI Data View is a new data view type that turns your patient data into on-demand intelligence. Administrators define a prompt once in the Designer and the result appears directly in the patient record, every time a care team member opens it.
It’s not limited to summaries. Configure it to analyze trends, flag care gaps, surface recommendations, aggregate data from multiple sources, or anything else your program needs. The prompt is yours to define.
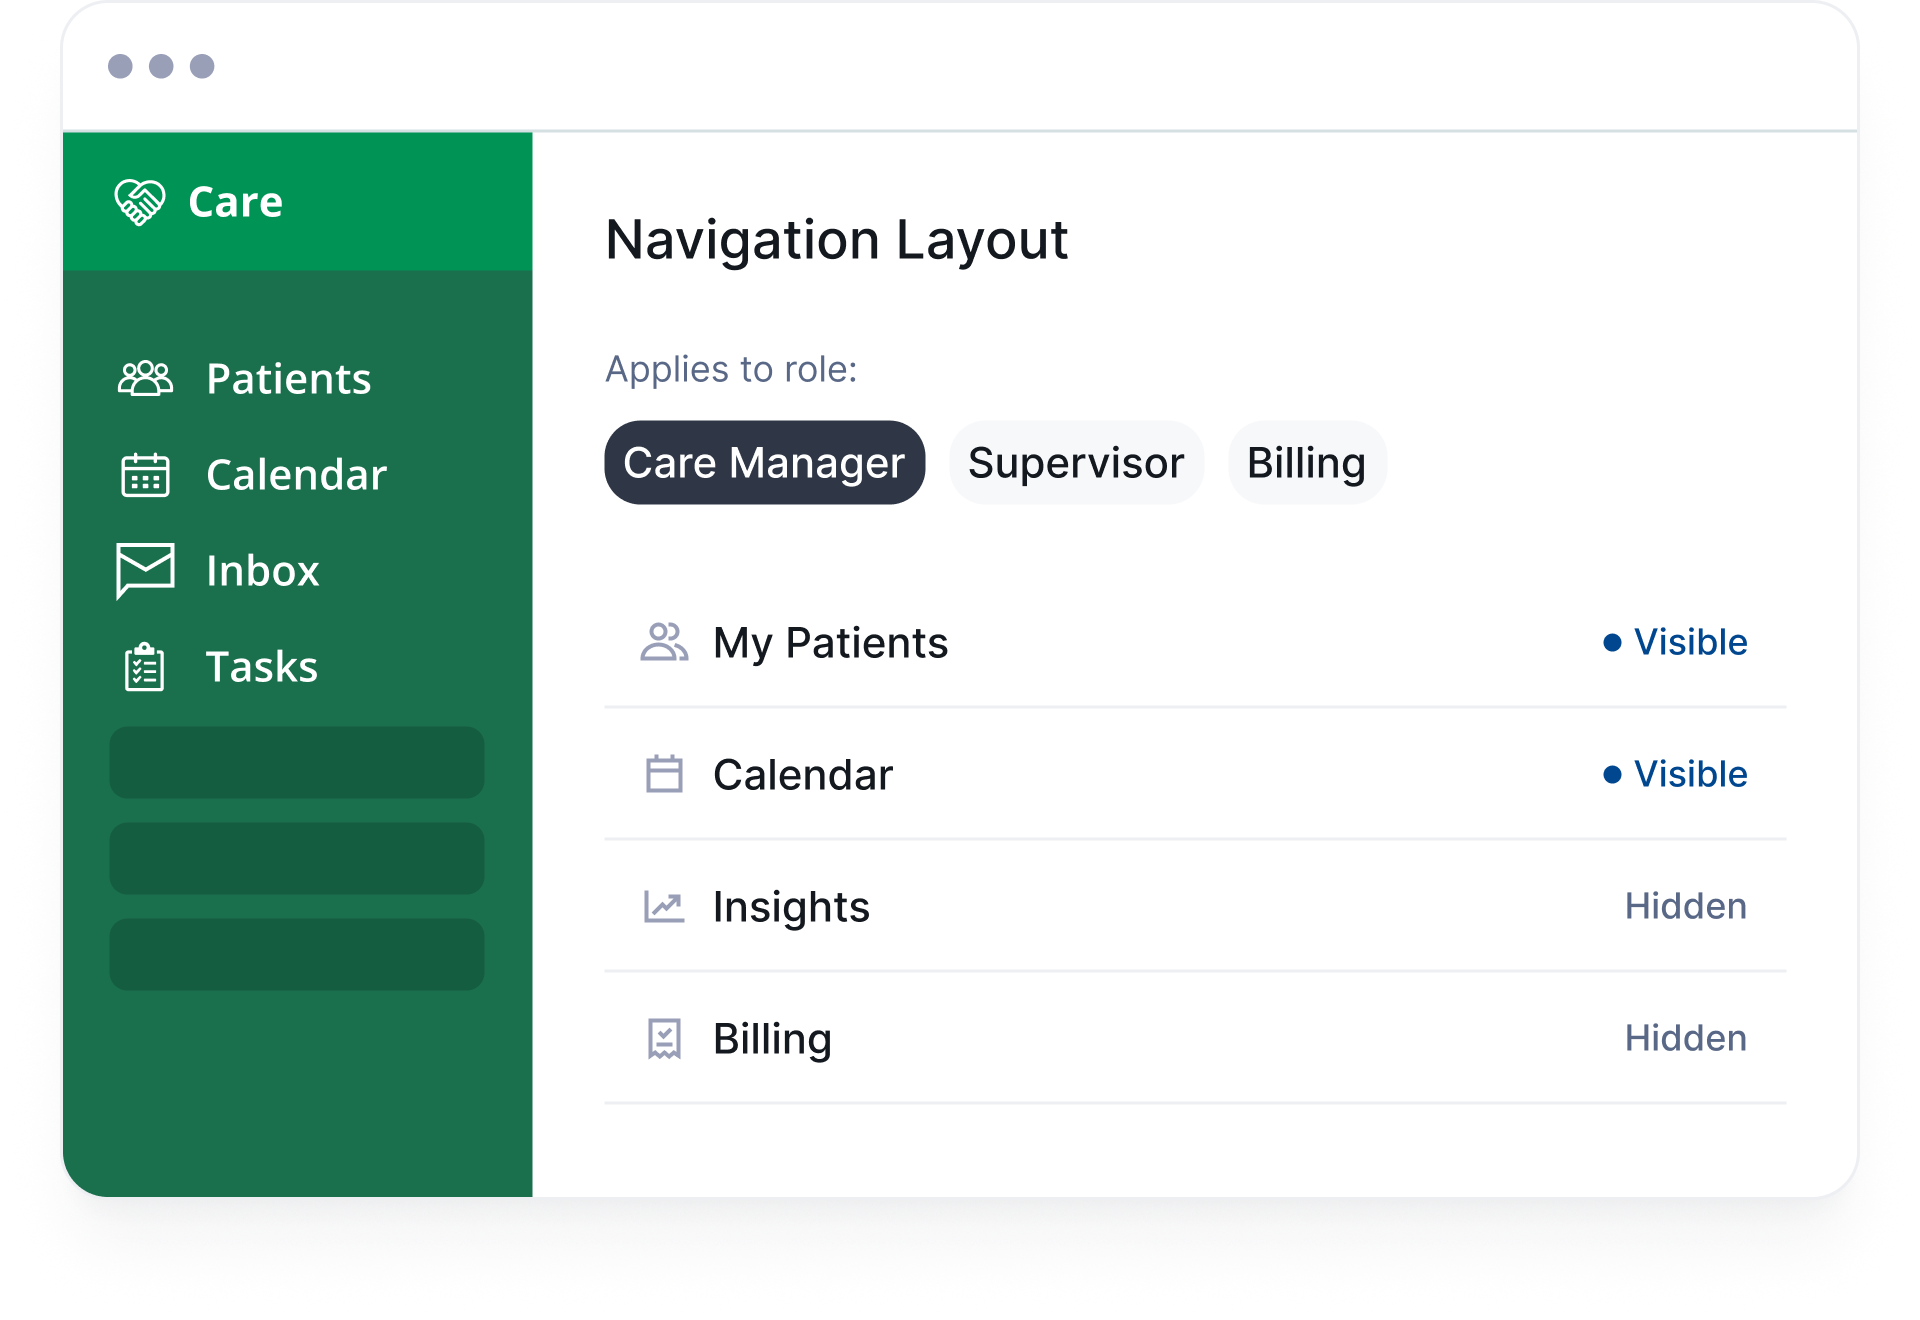
In the Designer, administrators control which pages appear in the Care Portal sidebar and in what order. Pages excluded from a role’s navigation are completely invisible to that team. Every role in your organization – care managers, supervisors, billing staff, or any other gets a focused workspace with no distractions from features that don’t apply to them.
Data Views display your clinical data objects in a configurable table – vitals, medications, lab values, or anything else your program tracks. Administrators choose what to surface and for which roles. Care teams get a clean, spreadsheet-style view of patient history without digging through individual entries.
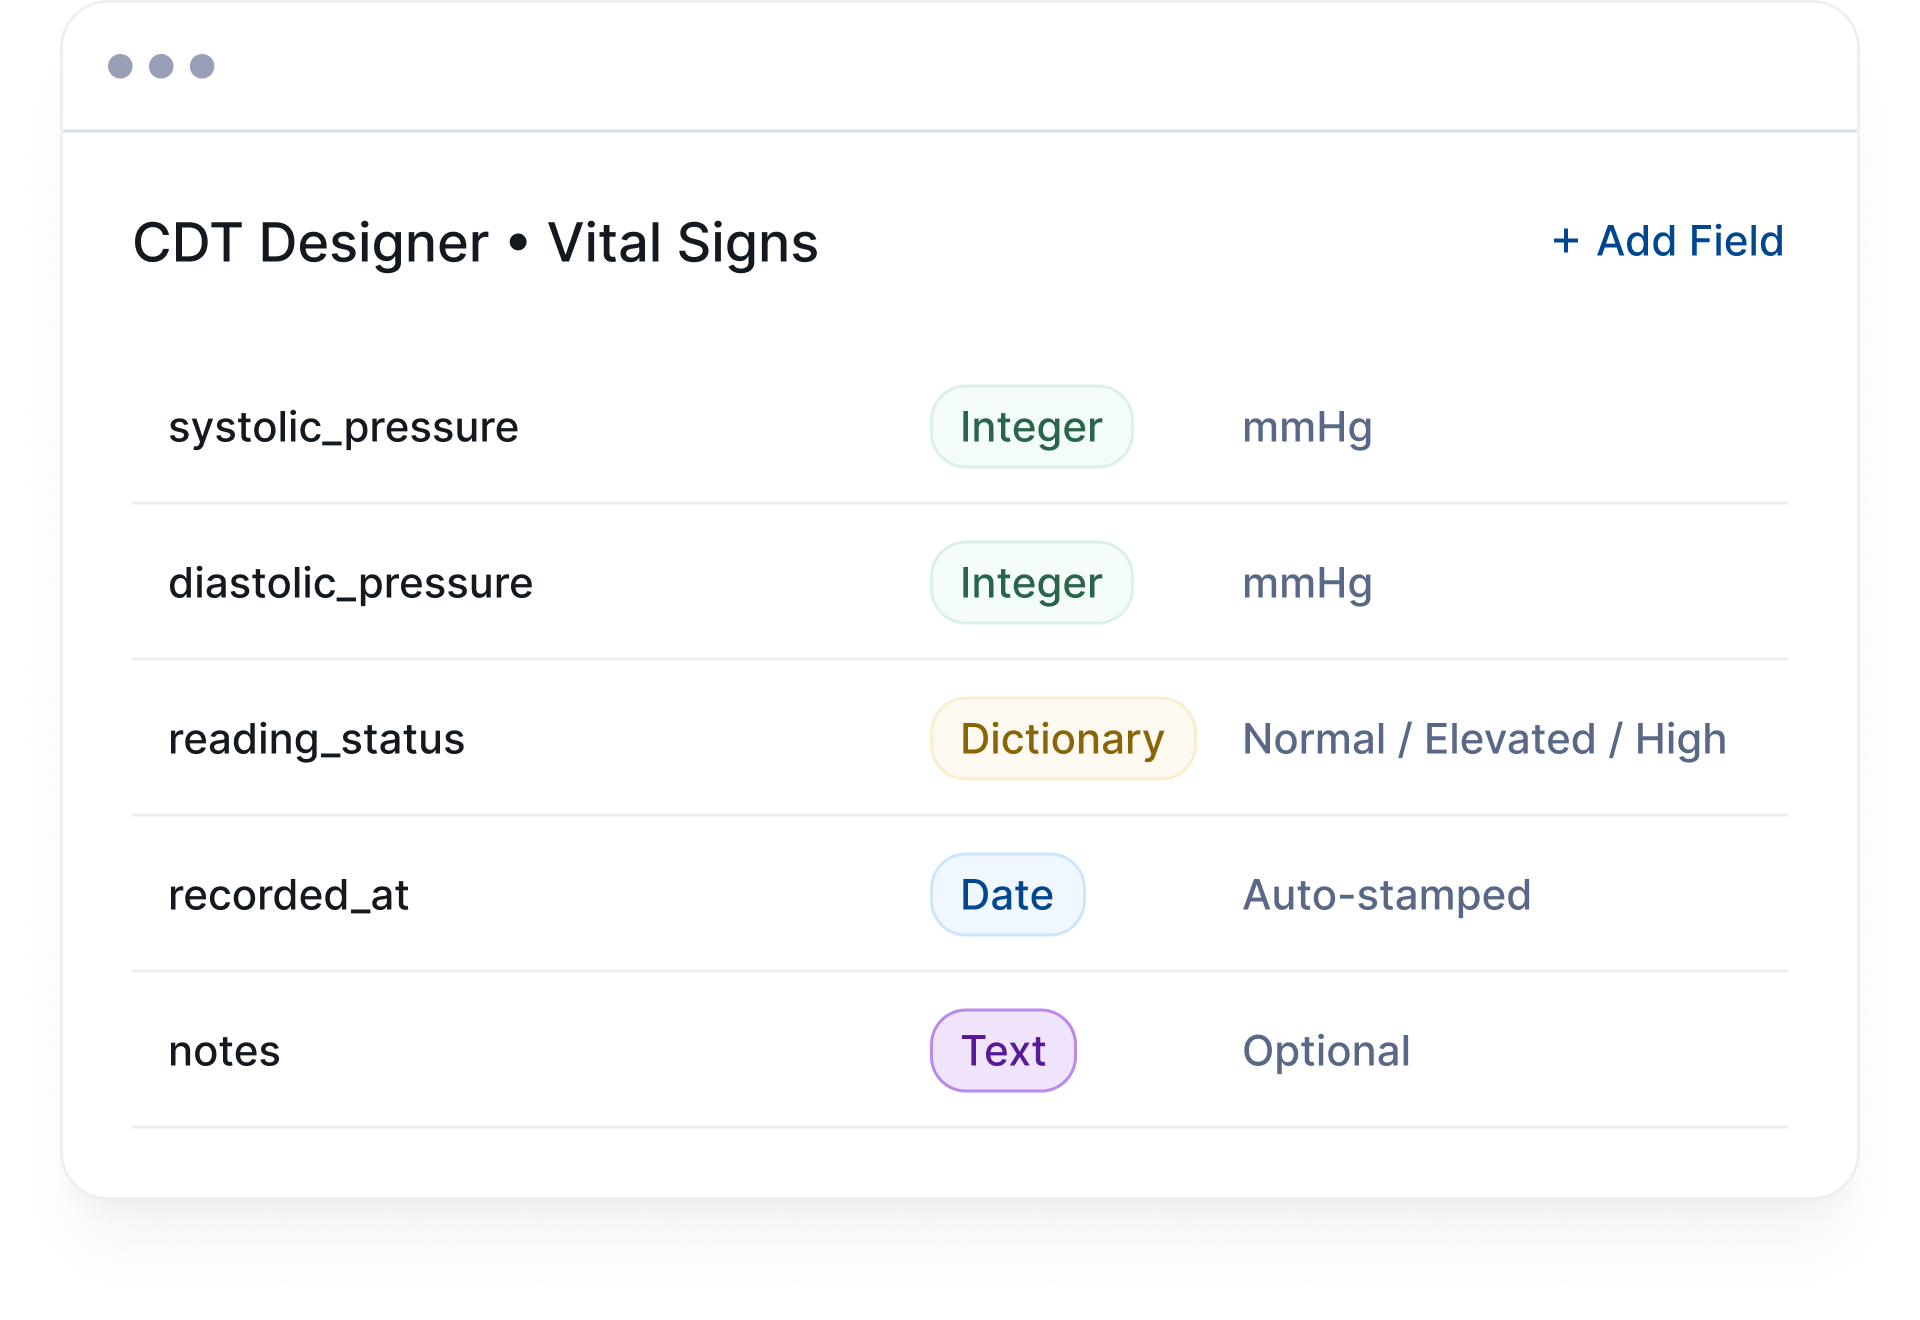
Welkin lets you build your own clinical data objects (called Custom Data Types, or CDTs) from scratch, without engineers. You decide what fields to include, what format they take, and what values are valid. Need a drop-down for medication status? A numeric field for vitals? A free-text note? Define it once in the Designer, and it flows into Data Views, charts, assessments, and automations automatically.
Configure line charts directly from CDT numeric fields or scored assessments. Care teams see patient progress over time without leaving the patient profile. Set target lines, define time ranges, and overlay multiple metrics on a single chart. All configured in the Designer, no code required.
David · Chief Technology Officer